Frame Display Formats
The frame supports two ways to view your query results: Graph and Table formats.
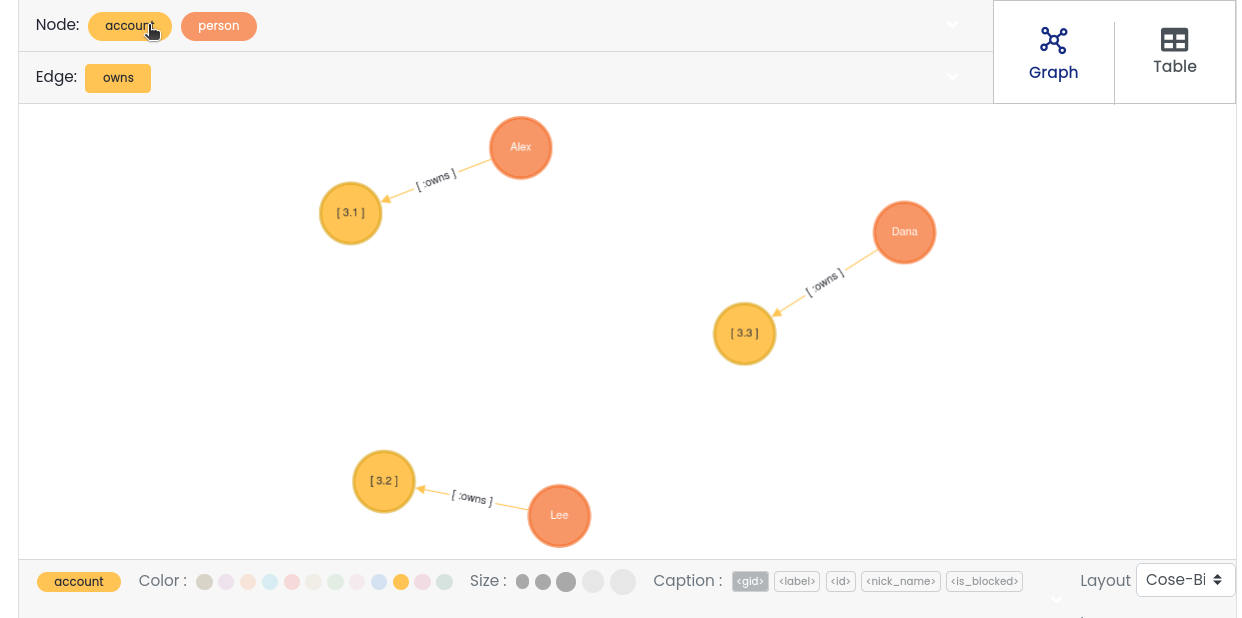
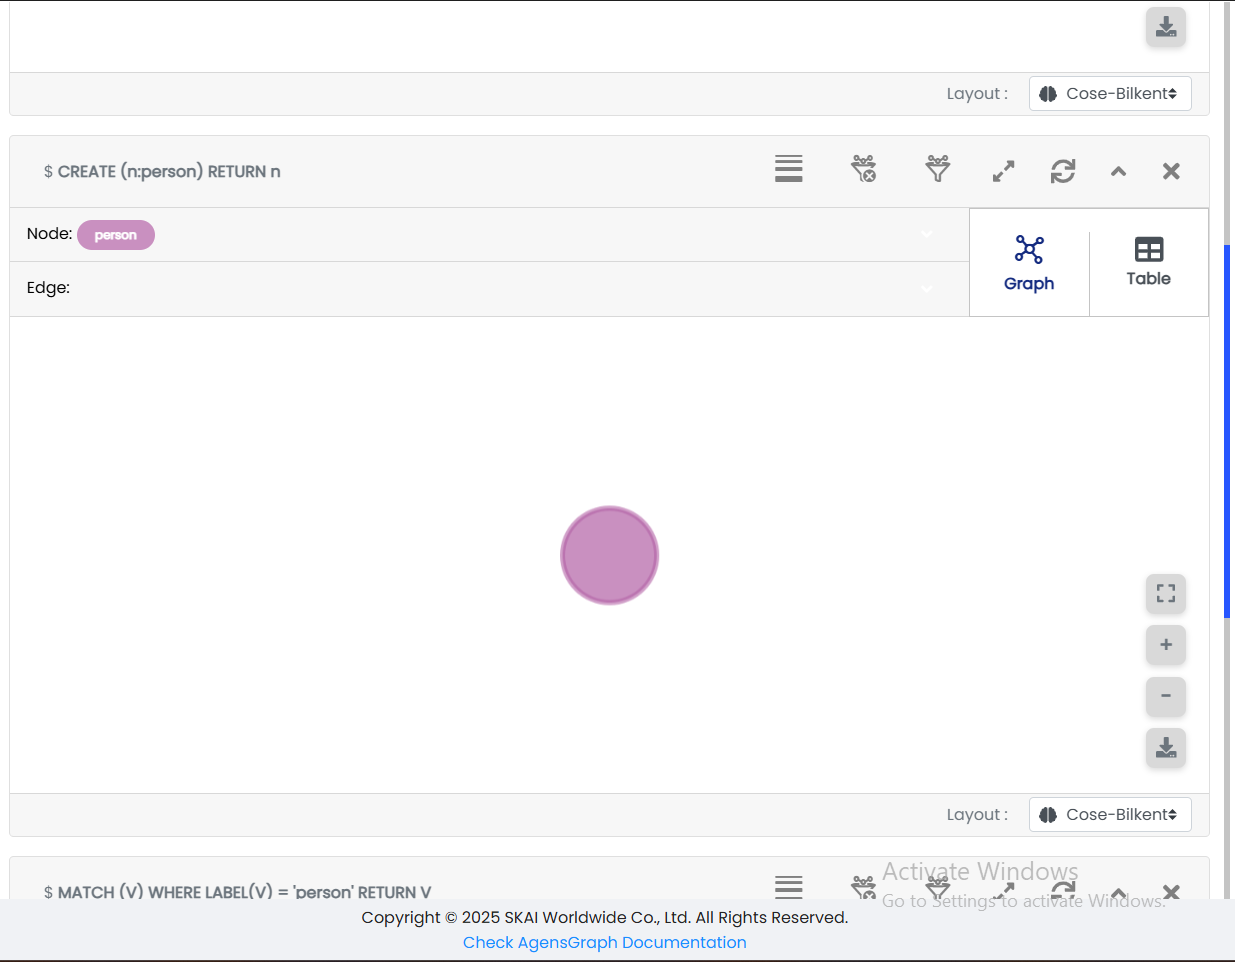
Graph Format
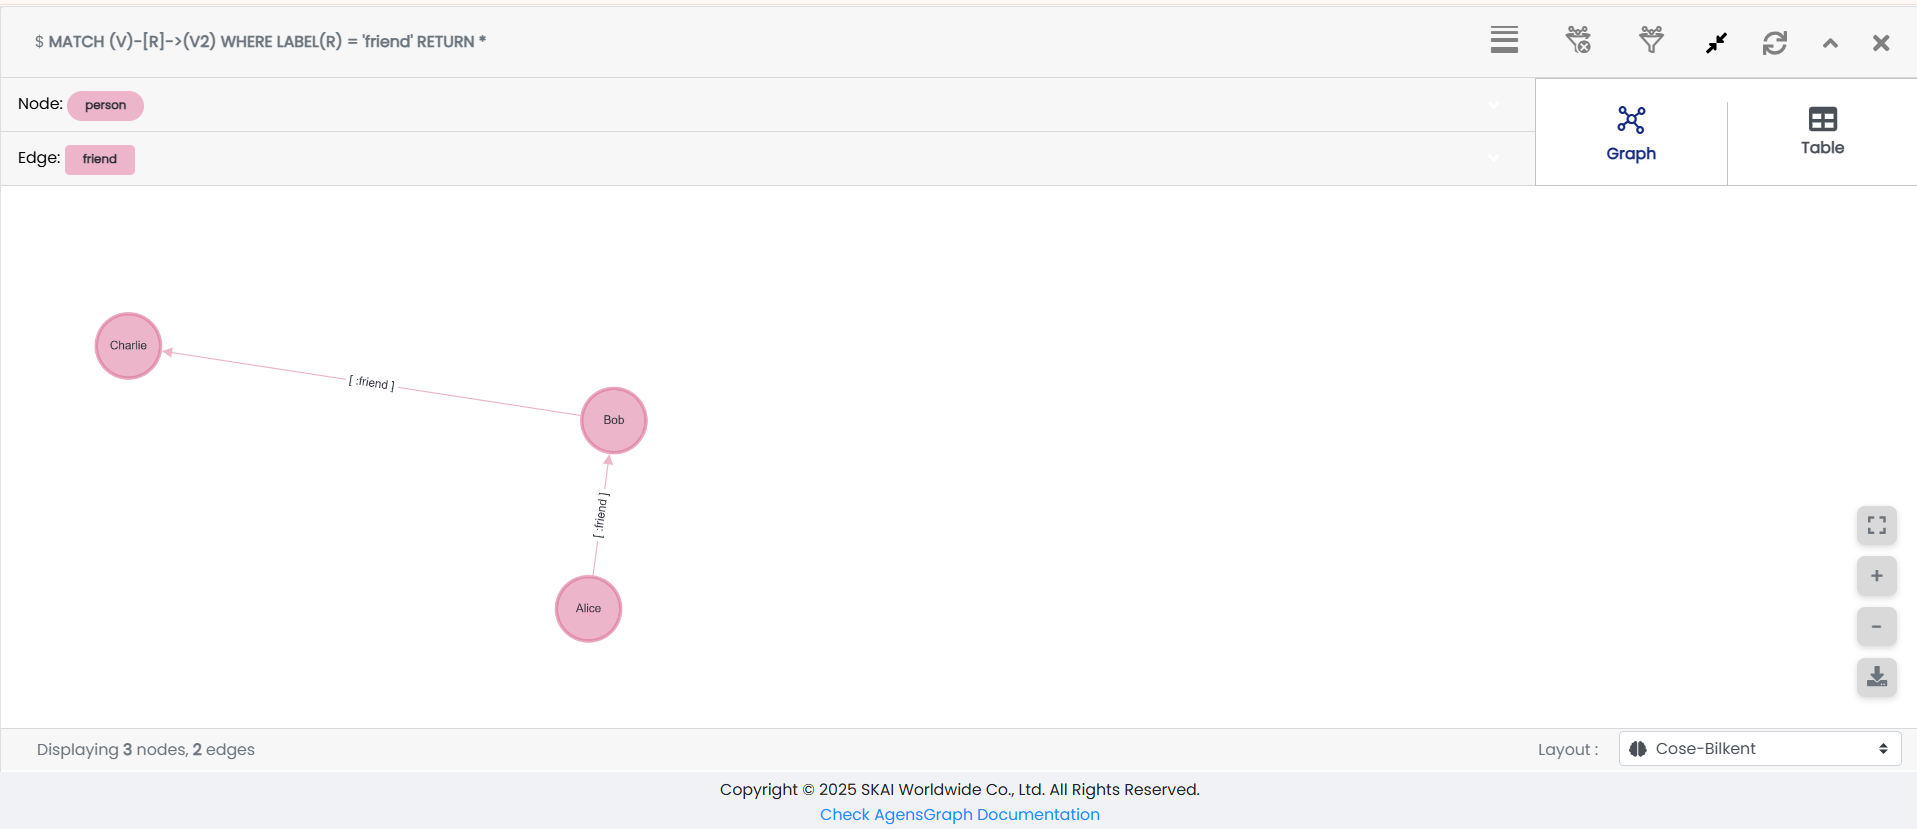
Components
Node List / Selector
Displays node labels from the result. Selecting a label highlights all matching nodes. You can edit color, size, and caption for nodes.
Edge List / Selector
Displays edge labels similarly to nodes. Select to highlight and edit edges.
Format Switcher
Toggle between graph and table views.
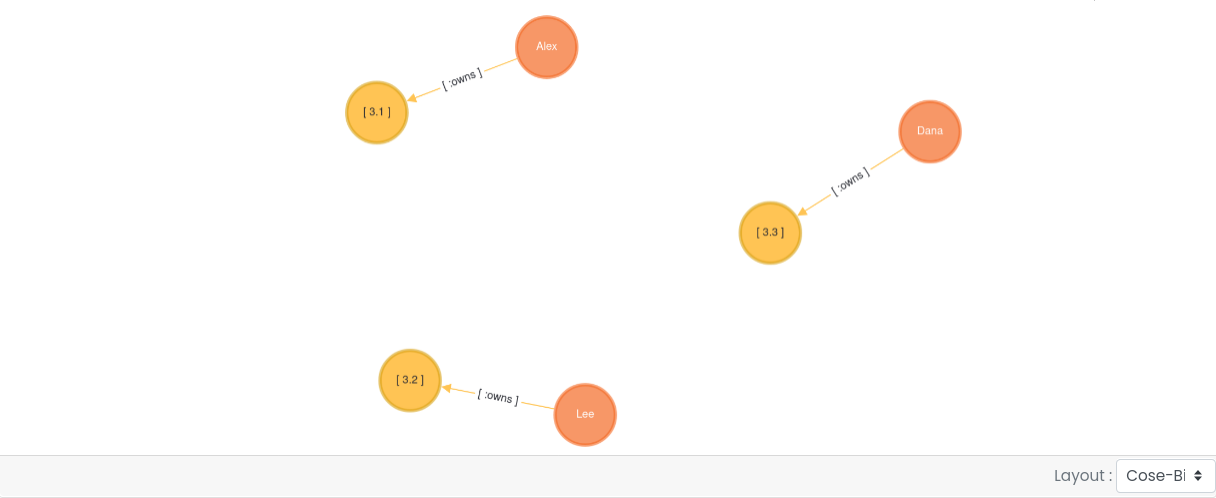
Graph Display Area
Shows nodes and edges. Clicking a node or edge displays its unique ID and properties.
Layout Settings
Choose from 12 layout styles (default iscose-bilkent), including:random, grid, breadth-first, concentric, cola, cose, dagre, klay, euler, avsdf, spread
Graph Property Editor
Customize selected nodes/edges with:Color, size, and up to two captions (captions are node/edge properties)
Changes are local to the frame only.
Drag empty space to move the entire graph view.
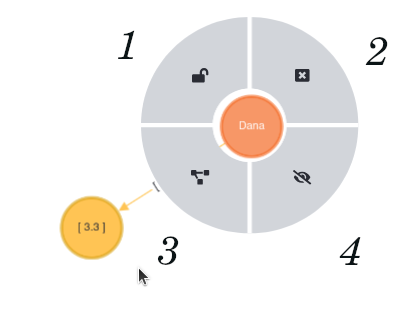
Right-click on a node opens menu options:
Fix/Return Node — Reset node to original position.
Close Menu — Close the right-click menu.
Expand Node — Add connected adjacent nodes and edges.
Hide Node — Remove node from view (does not delete data).
Multi-Node Selection
Double-click a node to select it and its adjacent nodes.
Repeating double-click selects nodes connected further.
Drag all selected nodes together.
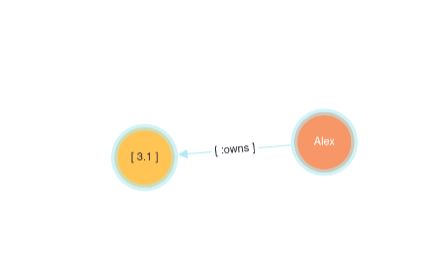
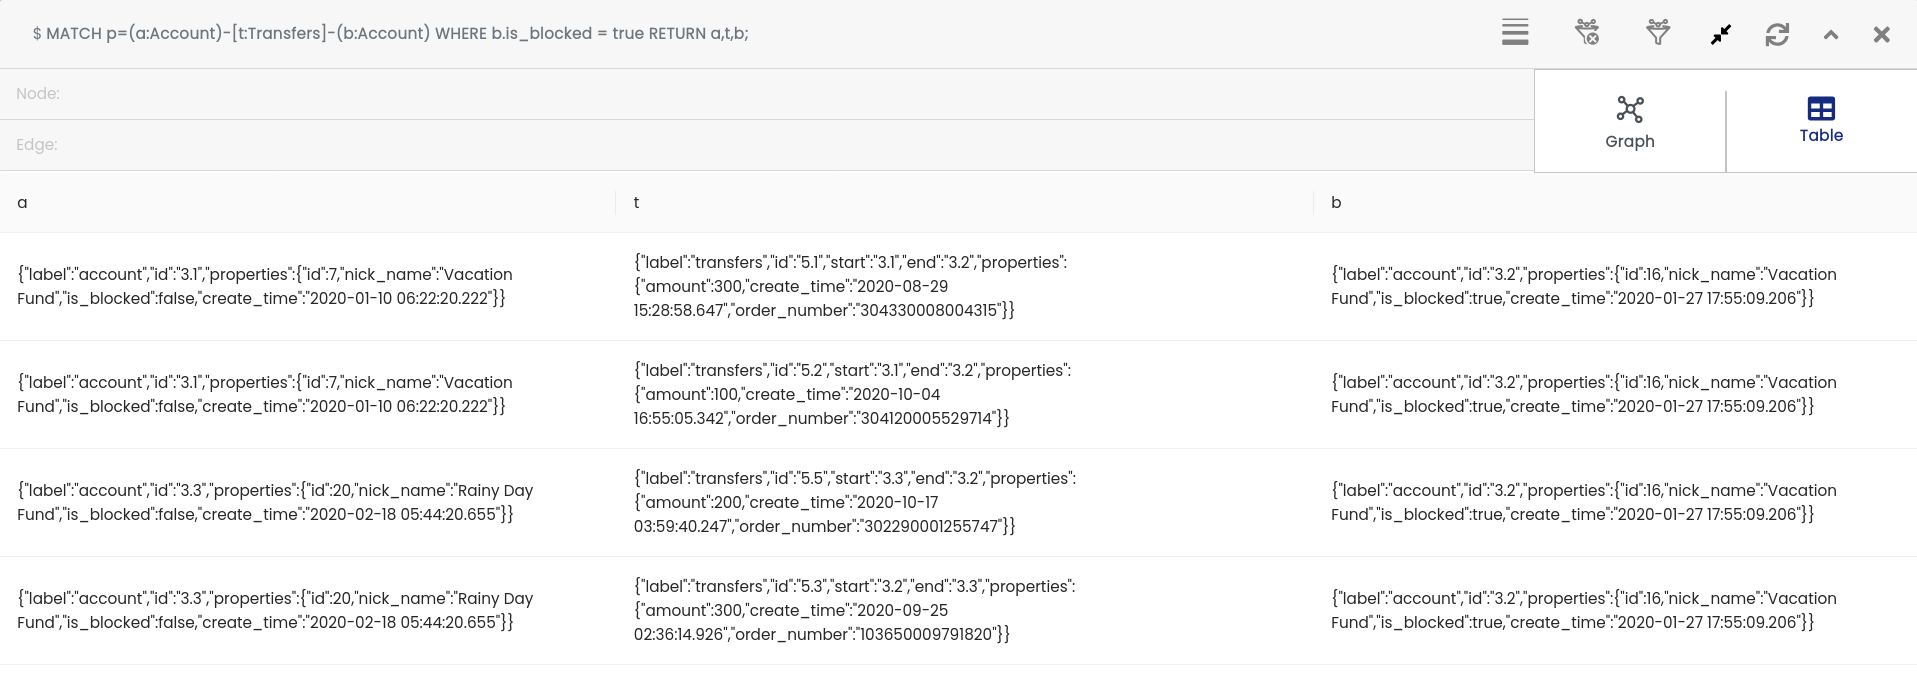
Table Format
Displays query results in a tabular form.
Header shows aliases specified in the query.
Rows show the actual data.
View Controls
Fit to View
Re-center and scale the graph to fit perfectly within the visible area.
Useful after panning or zooming.
Zoom In/Out
Control graph zoom with Zoom In and Zoom Out buttons.
Mouse scroll and trackpad pinch gestures also supported.
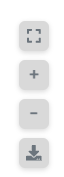
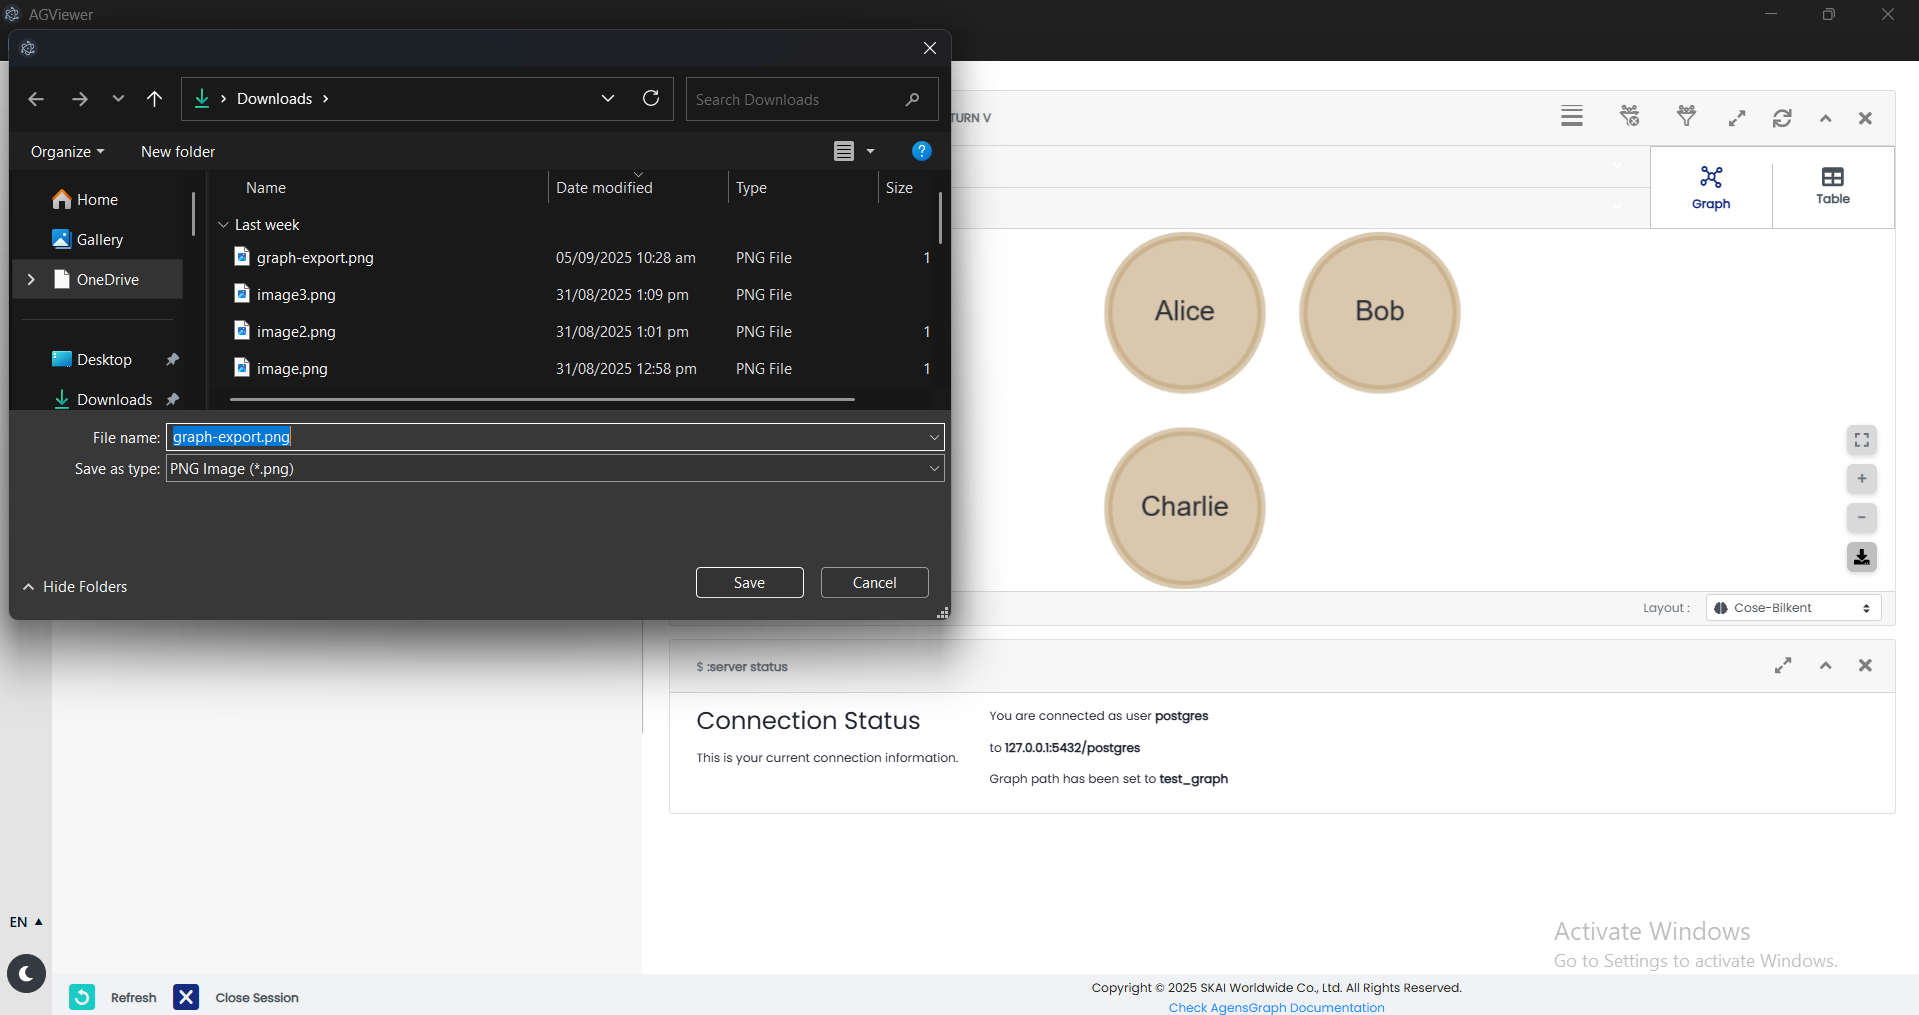
Export Image
Download the current graph visualization as an image file with your custom name.
Scroll Feature
Graph canvas now supports smooth scrolling and navigation.
Improved usability for large notifications and options.
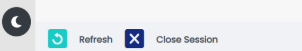
Footer Refresh & Close Background
Buttons (Refresh and Close) now include a highlighted background situated in bottom left above footer.
Improves button visibility and user accessibility.