Frame Display Formats
The frame supports two ways to view your query results: Graph and Table formats.
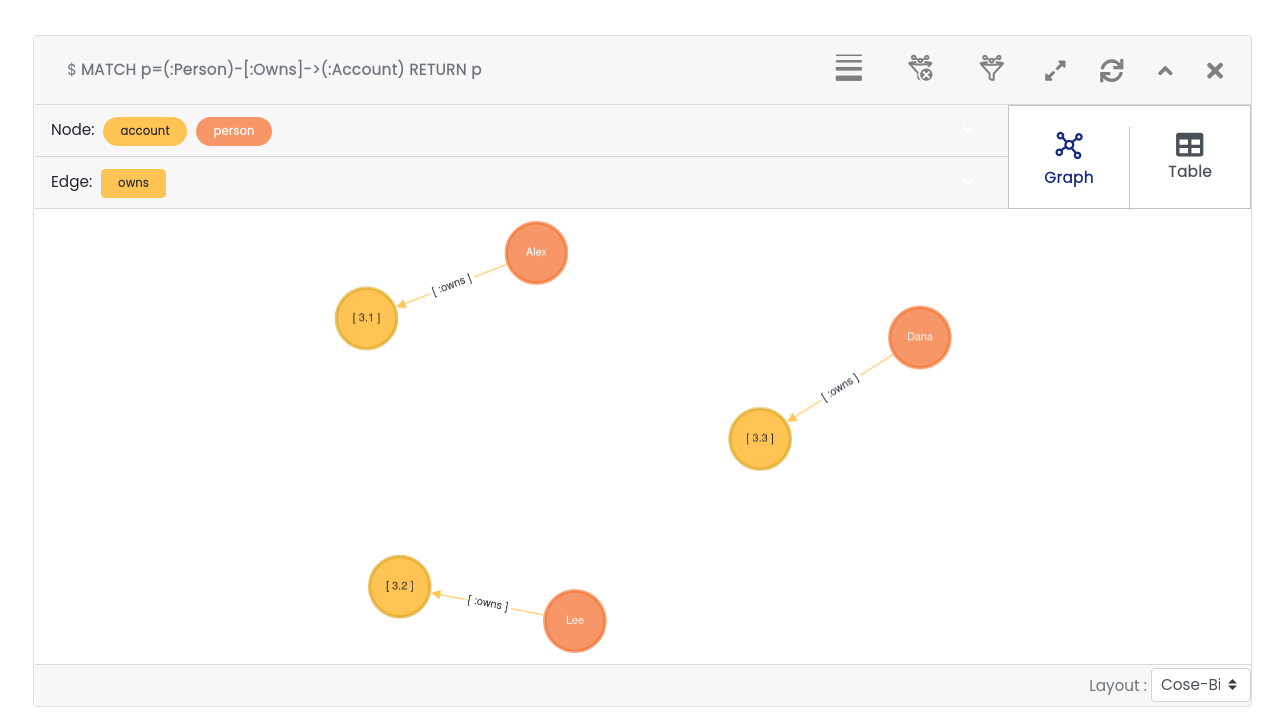
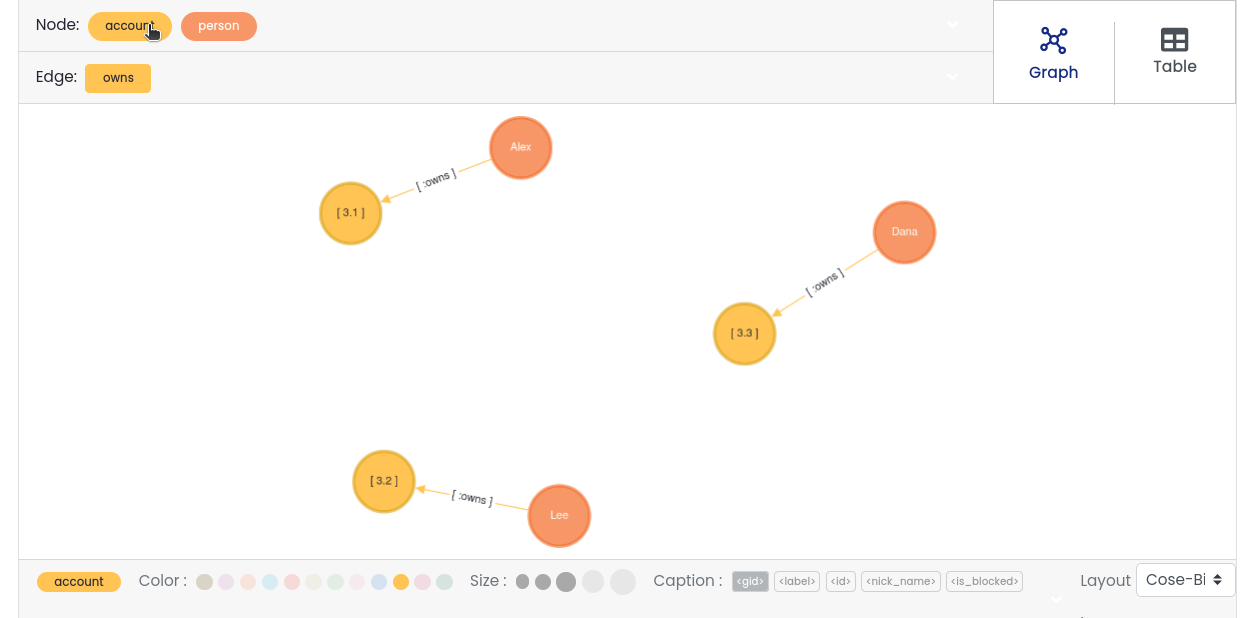
Graph Format
Components
Node List / Selector
Displays node labels from the result. Selecting a label highlights all matching nodes. You can edit color, size, and caption for nodes.
Edge List / Selector
Displays edge labels similarly to nodes. Select to highlight and edit edges.
Format Switcher
Toggle between graph and table views.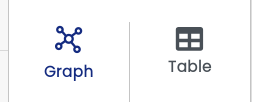
Graph Display Area
Shows nodes and edges. Clicking a node or edge displays its unique ID and properties.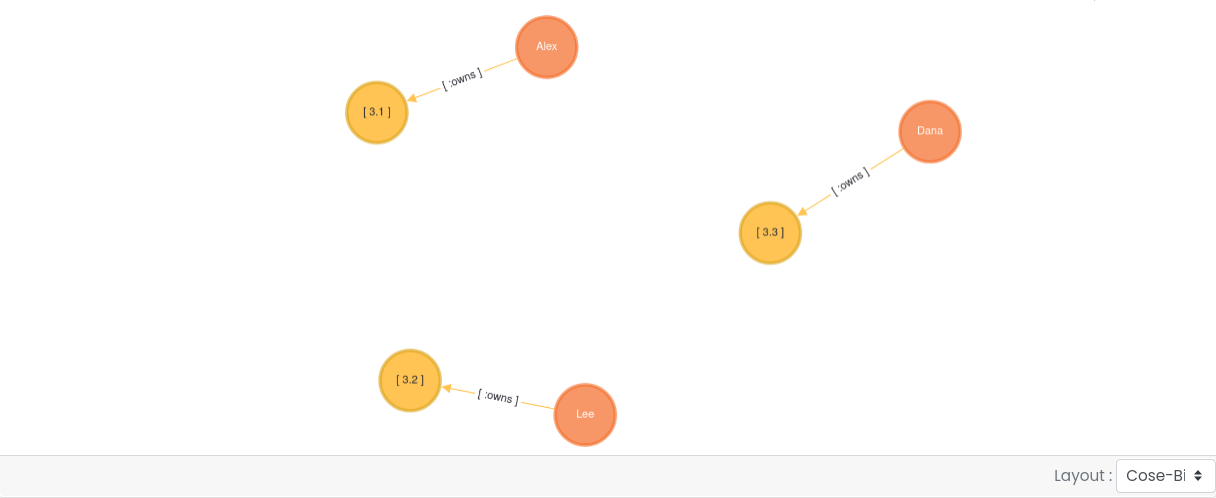
Layout Settings
Choose from 12 layout styles (default iscose-bilkent), including:random, grid, breadth-first, concentric, cola, cose, dagre, klay, euler, avsdf, spread

Graph Property Editor
Customize selected nodes/edges with:Color, size, and up to two captions (captions are node/edge properties)
Changes are local to the frame only.
Drag empty space to move the entire graph view.
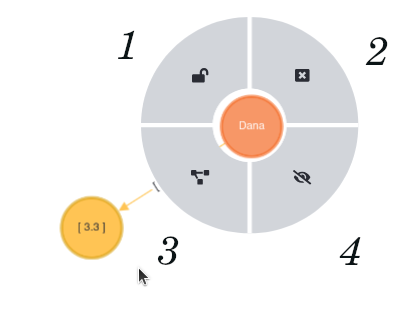
Right-click on a node opens menu options:
Fix/Return Node — Reset node to original position.
Close Menu — Close the right-click menu.
Expand Node — Add connected adjacent nodes and edges.
Hide Node — Remove node from view (does not delete data).
Multi-Node Selection
Double-click a node to select it and its adjacent nodes.
Repeating double-click selects nodes connected further.
Drag all selected nodes together.
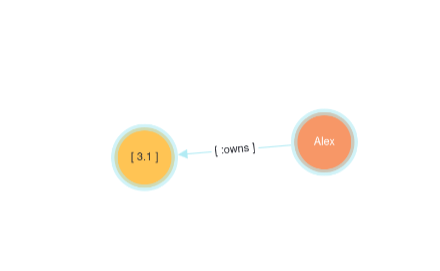
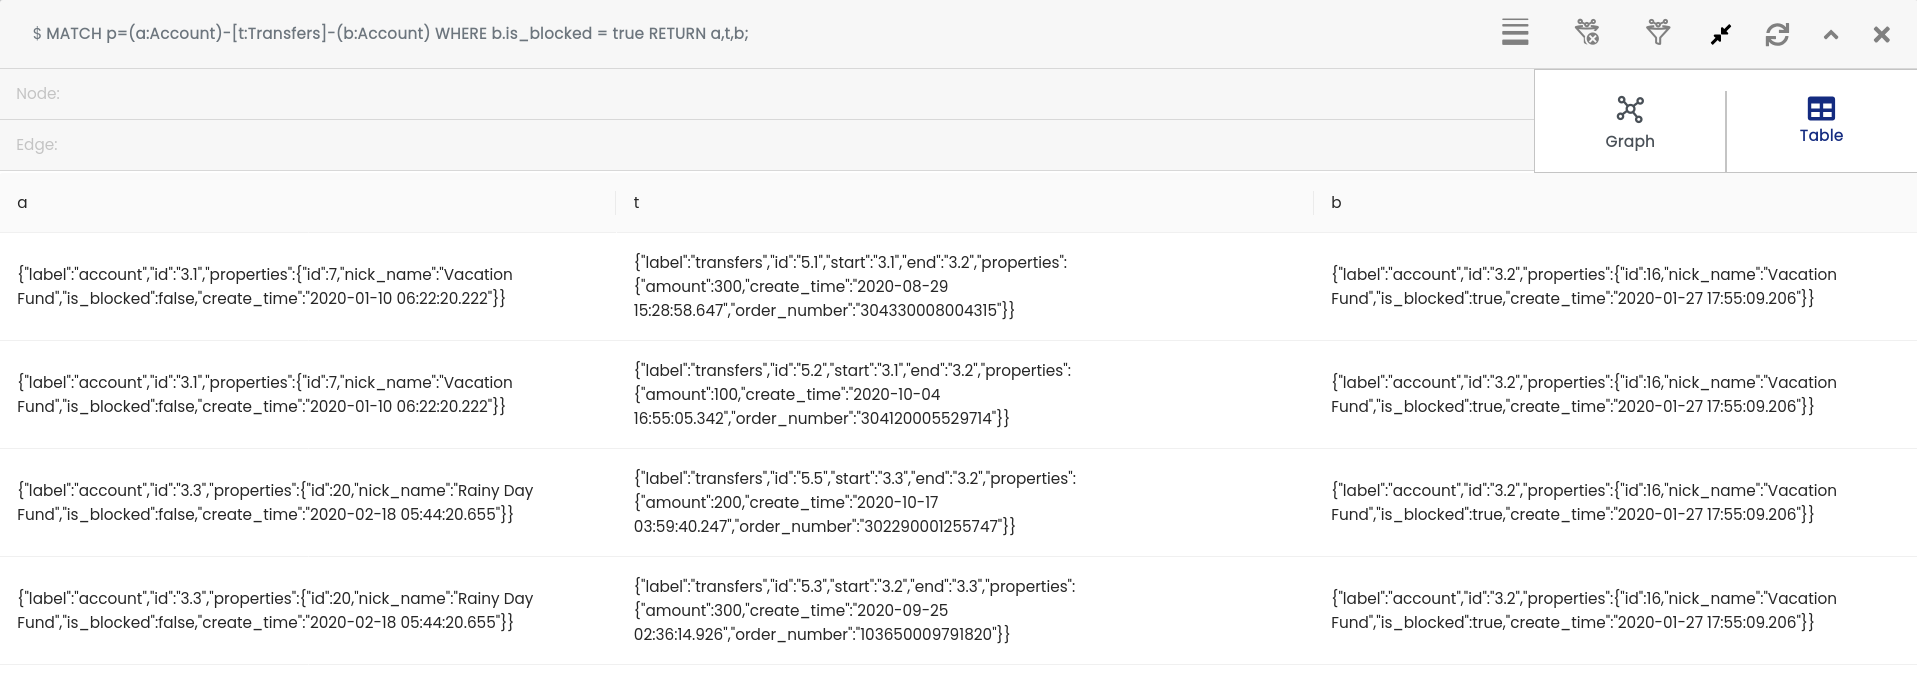
Table Format
Displays query results in a tabular form.
Header shows aliases specified in the query.
Rows show the actual data.